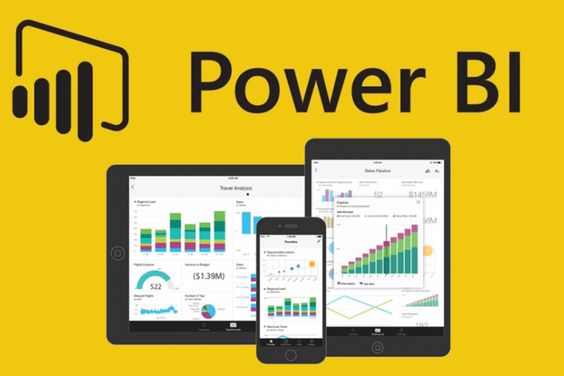
power bi
- instctor
-
Category
Data Analysis
-
Topics
PowerBI tools

Power BI course at DSSD Rohini: Empowering You with Data Analytics Skills
Are you looking to master the art of data analytics and visualization? If yes, then look no further than DSSD Rohini's Power BI course. With our comprehensive course curriculum, experienced faculty, and state-of-the-art infrastructure, we aim to equip you with the necessary skills to excel in the field of data analytics.
Why Choose DSSD Rohini?
DSSD Rohini is the best institute for Data Analytics in Rohini and offers the best Power BI course near you. Our focus on providing quality education and personalized attention to every student sets us apart from the rest. Here are a few reasons why you should choose DSSD Rohini for your Power BI training:
Experienced Faculty: Our faculty comprises industry experts with years of experience in the field of data analytics and business intelligence. They are committed to providing you with a comprehensive understanding of Power BI and its applications.
Hands-on Learning: Our course curriculum emphasizes hands-on learning through real-world case studies and projects. This approach ensures that you gain practical experience and are job-ready from day one.
State-of-the-Art Infrastructure: We provide our students with a state-of-the-art learning environment that includes high-speed internet connectivity, advanced computer labs, and modern audio-visual equipment.
course Details:
Our Power BI course is a comprehensive program designed to cover all aspects of data analytics and visualization using Power BI. The course is divided into modules that cover the following topics:
Introduction to Power BI: The course starts with an overview of Power BI and its features, including data modeling, data preparation, and data visualization.
Power Query: In this module, you will learn how to use Power Query to transform and manipulate data from various sources.
Data Modeling: This module covers data modeling techniques, including creating relationships, hierarchies, and calculations.
DAX Functions: In this module, you will learn about DAX functions and how to use them to create advanced calculations and measures.
Data Visualization: This module covers best practices for data visualization and how to create interactive and engaging dashboards using Power BI.
Why Use Power BI course?
Power BI is one of the leading data analytics and visualization tools in the market today. It is used by businesses of all sizes to analyze and visualize data, gain insights, and make informed decisions. Here are a few reasons why you should use Power BI:
Easy to Use: Power BI is user-friendly and can be used by anyone, regardless of their technical expertise.
Integration with Other Tools: Power BI integrates with other Microsoft tools such as Excel, SharePoint, and Dynamics 365, making it easy to import and export data.
Cloud-based: Power BI is a cloud-based solution, which means that you can access your data and dashboards from anywhere, at any time.
DSSD Rohini is the best institute for Data Analytics in Rohini and offers the best Power BI course near you. Our faculty comprises industry experts with years of experience in the field of data analytics and business intelligence. Our course curriculum emphasizes hands-on learning through real-world case studies and projects. We provide our students with a state-of-the-art learning environment that includes high-speed internet connectivity, advanced computer labs, and modern audio-visual equipment.
Conclusion:
In today's data-driven world, data analytics and visualization skills are in high demand. The Power BI course at DSSD Rohini equips you with the necessary skills to excel in the field of data analytics. With experienced faculty, hands-on learning, and state-of-the-art infrastructure, DSSD Rohini is the best